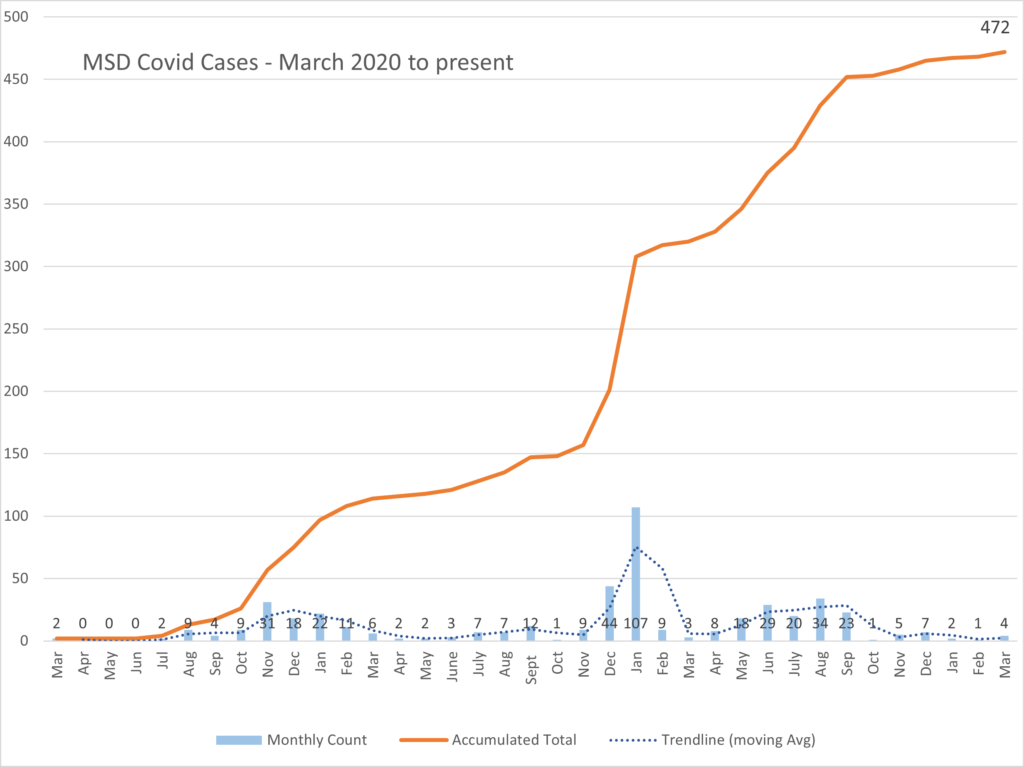
Below you will find updates on employee positivity rates.
To find the most recent COVID-19 communications as well as a list of COVID-19 resources, visit msdprojectclear.org/msdcorona.
Last updated 03/31/23
Employee Positivity Chart
| Timeframe | New COVID-19 Cases |
Total COVID-19 Cases |
| 2020 (Mar – Dec) | 75 | 75 |
| 2021 (Jan – Dec) | 126 | 201 |
| 2022 (Jan – Dec) | 264 | 465 |
| Jan 2023 | 2 | 467 |
| Feb 2023 | 1 | 468 |
| Mar 2023 | 4 | 472 |


